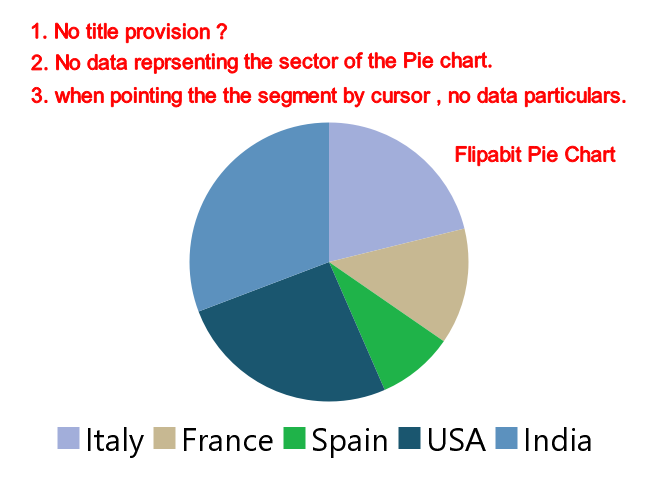
Can we make a Pie Chart exactly like this in Flipabit

Yesterday , I tried on charts in Flipabit.The pie chart, mostly used in Apps. is not upto the mark. Then I searched how to make charts using Javascript and QML. I found this more interesting and the latest one with all features. If any member had created pie chart exactly similar to this, plz upload the project. or this script code can be tried on flipabit. As all my efforts stood in vain. If not possible in it , plz suggest the Flipabit Devlopers to improve this feature in the next version.empty_14.flp (17.4 KB)
PieChart in Flipabit


Thanks in advance for any suggestion.

import QtQuick 2.15
import QtQuick.Controls 2.15

Item {

    Canvas {
        id: canvas
        anchors.fill: parent
        onPaint: {
            var ctx = canvas.getContext('2d');
            var total = 0;
            var data = [
                {label: "Сегмент 1", value: 30, color: "#FF0000"},
                {label: "Сегмент 2", value: 50, color: "#00FF00"},
                {label: "Сегмент 3", value: 20, color: "#0000FF"}
            ];

            // Вычисляем сумму всех значений
            for (var i = 0; i < data.length; i++) {
                total += data[i].value;
            }

            var startAngle = 0;

            // Рисуем каждый сегмент
            for (var i = 0; i < data.length; i++) {
                var sliceAngle = 2 * Math.PI * (data[i].value / total);
                ctx.beginPath();
                ctx.moveTo(canvas.width / 2, canvas.height / 2);
                ctx.arc(canvas.width / 2, canvas.height / 2, Math.min(canvas.width, canvas.height) / 2 - 10, startAngle, startAngle + sliceAngle);
                ctx.closePath();
                ctx.fillStyle = data[i].color;
                ctx.fill();

                startAngle += sliceAngle;
            }

            // Добавляем легенду
            var legendY = 10;
            var legendX = canvas.width - 120;
            for (var i = 0; i < data.length; i++) {
                ctx.fillStyle = data[i].color;
                ctx.fillRect(legendX, legendY, 15, 15);
                ctx.fillStyle = "#000";
                ctx.fillText(data[i].label + " (" + data[i].value + ")", legendX + 20, legendY + 12);
                legendY += 20;
            }
        }
    }
}
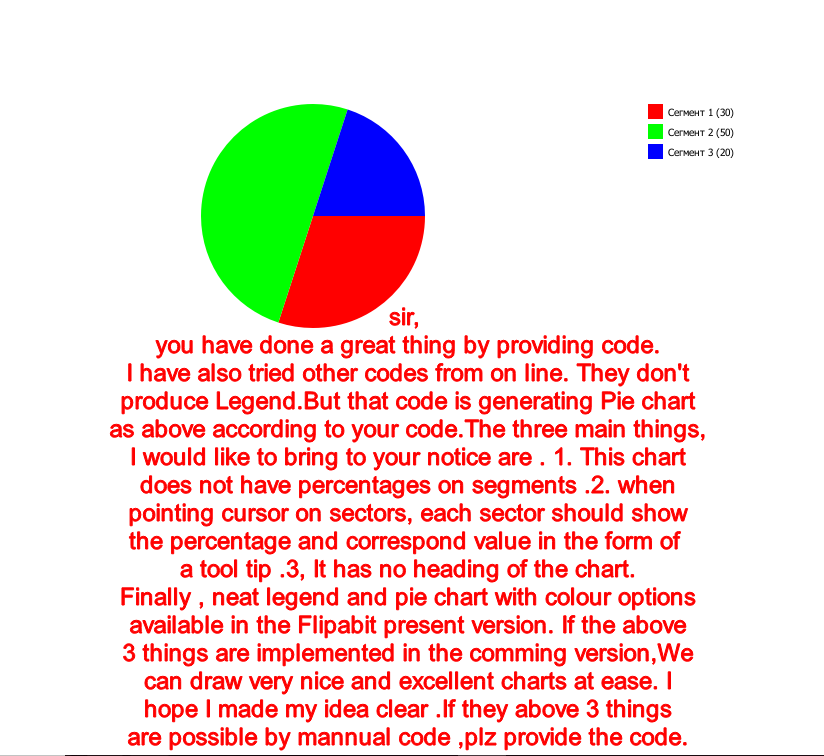
Vladimir_PV Sir, Thank you for providing the QML code for Pie chart. I tried your code and its pie chart with comments submitted here for your further consideration.
Piechart improvements


Back to Flipabit >
Copyright © 2018. Flipabit Team. All rights reserved.