Hi,
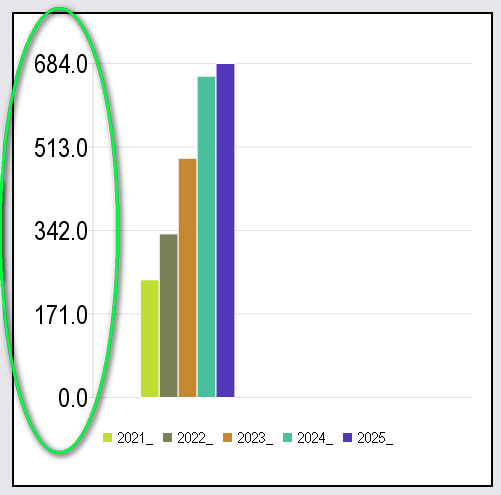
I could build a chart, based on data from a Google Sheet, but I cannot format the Y-axis.
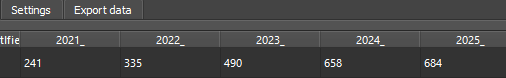
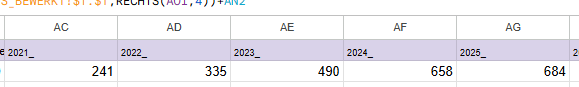
In my Google Sheet AND in Flipabit, the data are normal integers, but the Y-axis shows one decimal digit.
How can I fix this?
Wim

Hi,
I could build a chart, based on data from a Google Sheet, but I cannot format the Y-axis.
In my Google Sheet AND in Flipabit, the data are normal integers, but the Y-axis shows one decimal digit.
How can I fix this?
Wim
Guten Morgen,
hier ist ein Bsp.
import QtQuick 2.15
import QtQuick.Controls 2.15

ApplicationWindow {
    visible: true
    width: 400
    height: 300
    title: "Zahlenformatierung"

    Column {
        anchors.fill: parent
        spacing: 10
        padding: 20

        // Ganze Zahl ohne Formatierung
        Text {
            text: "Unformatierte Zahl: " + 123456789
            font.pointSize: 16
        }

        // Ganze Zahl mit Komma als Tausendertrennzeichen
        Text {
            text: "Formatierte Zahl: " + (123456789).toLocaleString()
            font.pointSize: 16
        }

        // Ganze Zahl mit benutzerdefiniertem Format (z.B. mit führenden Nullen)
        Text {
            text: "Zahl mit führenden Nullen: " + ("000" + 42).slice(-3) // Gibt '042' zurück
            font.pointSize: 16
        }
    }
}
toLocaleString(), um die Zahl mit einem Komma als Tausendertrennzeichen anzuzeigen (abhängig von den regionalen Einstellungen).Thanks, but how can I “link” this code to the Y-axis of my chart?
It’s the first time I see such a code and I only see “text” (maybe a text-widget) ?
Hier ist ein tolles Bsp. wie man Widget mit Componenten Verknüpft.