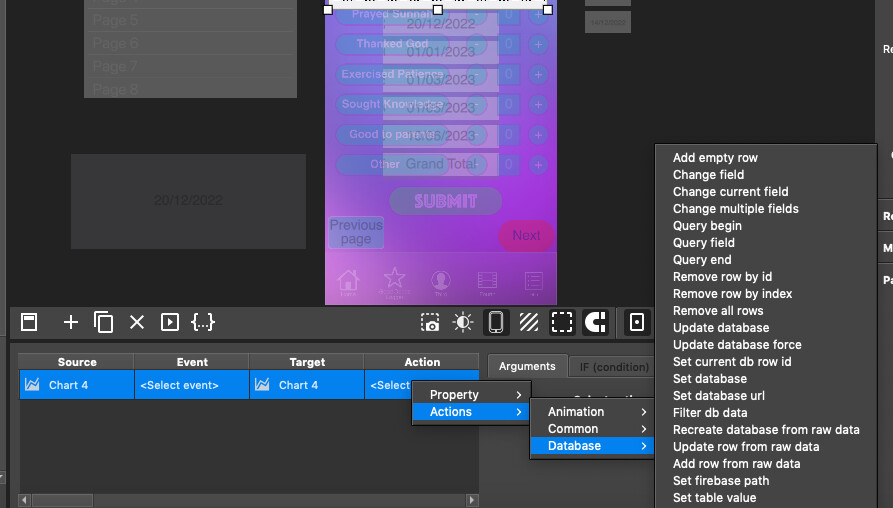
Anyone got advice on how to make interactive charts - im trying to make charts which summarise data on a daily, weekly, monthly and yearly basis and the user can scroll through the data and look at previous and current data? I want to be able to click a button which will filter the data on the chart and only show e.g. todays data, or this weeks data or this months data etc