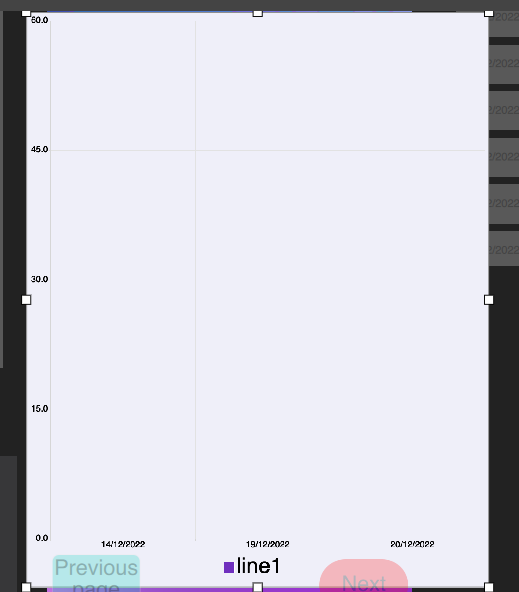
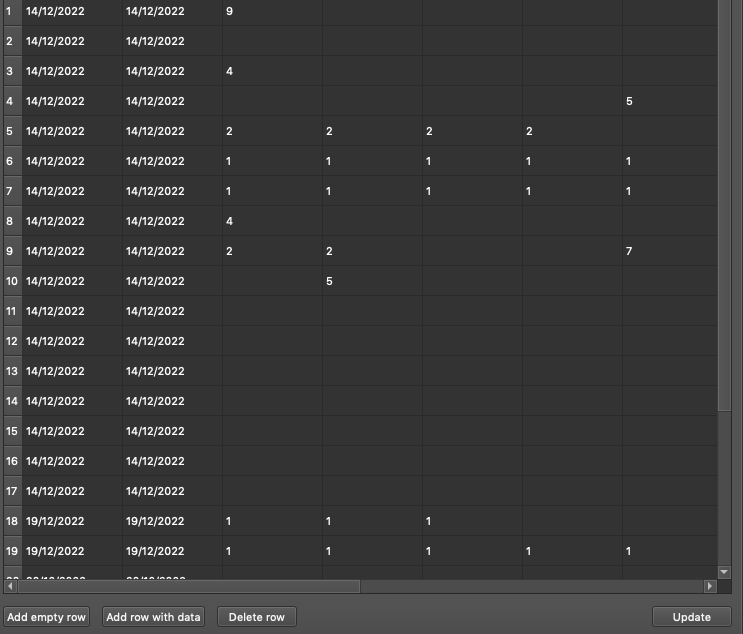
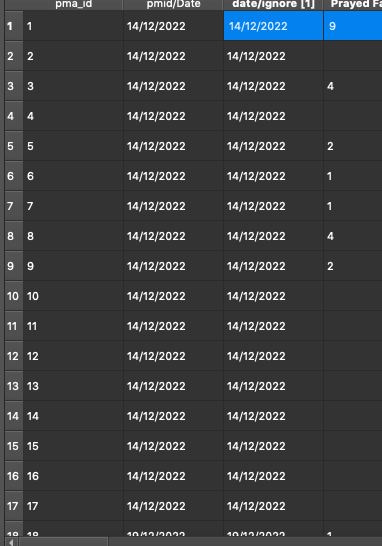
Hi I’ve been trying to represent my googlesheets data in a chart but its not coming up, the dates are on the X-axis but the Y axis should represent the number but for some reason the values aren’t coming up. See pics below. Please offer some help!


Hi I’ve been trying to represent my googlesheets data in a chart but its not coming up, the dates are on the X-axis but the Y axis should represent the number but for some reason the values aren’t coming up. See pics below. Please offer some help!


